Animal Reports From Team 2
Click the link for your child to see their Animal Report slide Sshow
aiden.wmv
Jax.wmv
josh.wmv
Tessellations
Definition
A tessellation is created when a shape is repeated over and over again covering a plane without any gaps or overlaps.
Another word for a tessellation is a tiling. Read more here: What is a Tiling?

We will be creating a slide show of tessellations. That you can view by clicking here!
We also learned how to take a Screen Shot, save and edit.
Ancient Egypt PowerPoint

Ancient Egypt Main Powerpoint.pptx
Prezi's

Each Student has their own Prezi login- Ask them to share theirs with you!
prezi.com/Prezi is a cloud-based presentation software that opens up a new world between whiteboards and slides. The zoomable canvas makes it fun to explore ideas ...
Spreadsheets R' Us
Sample Spreadsheets we have created in class
What is a Spreadsheet?
it's data displayed in rows and columns on a plane
Microsoft's Excel spreadsheet program is one of the most used spreadsheet applications
Excel's parts & its Worksheet are similar to Word & other Office applications. Many of the shortcuts in Word will work in Excel.
- CTRL+S to save
- CTRL+N for a new document
- CTRL+C to copy
- CTRL+X to cut
- CTRL+V to paste, etc.
Areas within a spreedsheet

Here is a basic link that covers most of what we do, although I have adjusted the cntent to be more schol relivant
http://ils.unc.edu/courses/2006_fall/inls261_001/sessions/20061024/16a.spreadsheets.intro.htm

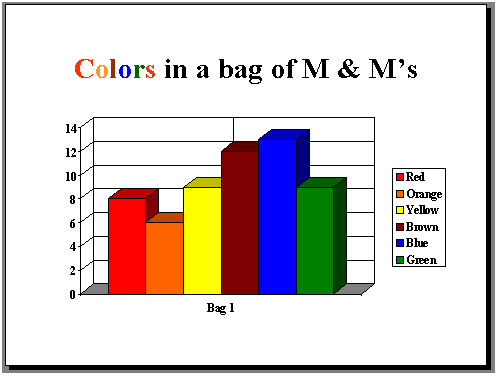
Creating an M&M Pictograph
1. Dump out your M&M's
2. Count how many of each color
3,. Open the link below and create a graph mocing the m's in colums to represent the amount you have of each color.
mM pictograph spreadsheet.xlsx
How is a pictograph differfent from a bar graph?


Comments (0)
You don't have permission to comment on this page.